The Pandemic's Local & Statewide Impact
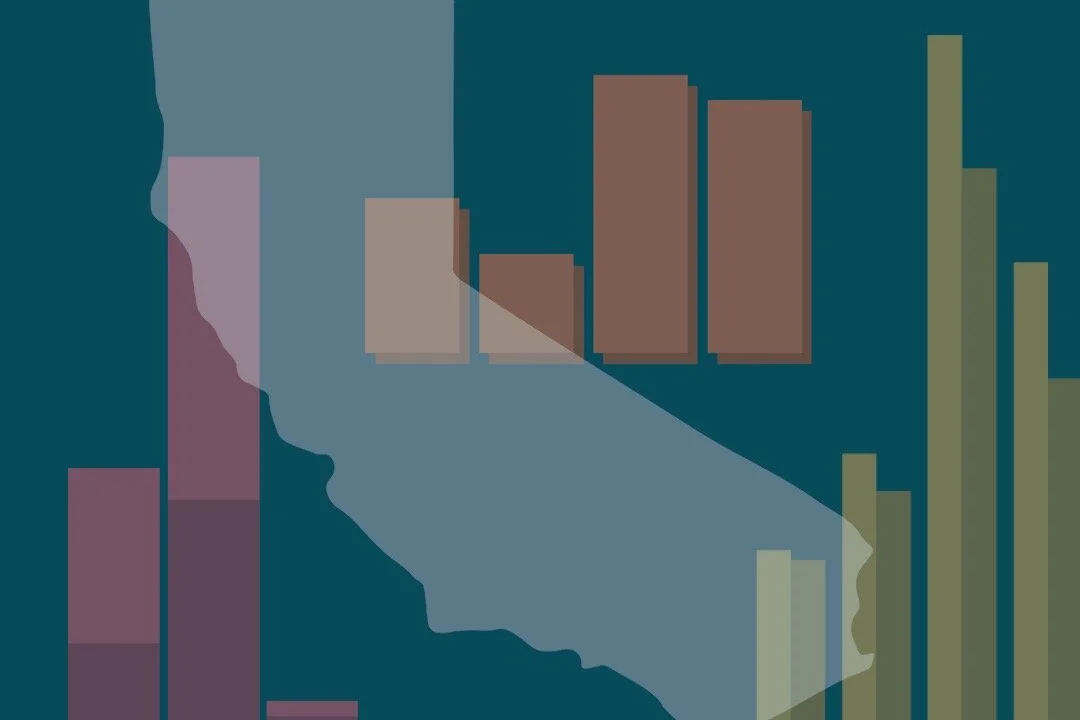
Infographic by Johnny Neville | The Corsair
The skies are still filled with planes coming and going from LAX. Lights twinkle across the city from office buildings and hotels. The hustle and bustle of L.A. continues even as the city enters another partial stay-at-home-order.
Throughout 2020, significant trends appeared at both the city and state levels regarding the timelines of COVID-19 cases, hospitalizations, and virus-related deaths. Similar spikes were seen in crime reported to Los Angeles Police Department (LAPD), unemployment rates, and air quality.
At the start of the year, pre-pandemic, unemployment rates stood at 4.5% in L.A. County and 4.3% in California, according to the state’s Employment Development Department. By July, these numbers ballooned to 18.5% in L.A. and 13.9% statewide. The most recent report from October showed rates had dropped to 12.1% in L.A. and 9.0% statewide, but still haven’t recovered from the pandemic’s impact.
COVID-19 deaths further depict this trend of numbers spiking in the summer and dipping in the fall. In March, L.A. County reported 95 new deaths, and the state reported 193. In July, L.A. spiked to 1,192 deaths and the state to 3,134. In October, rates were down significantly, L.A. reporting 453 the state reporting 1,779. As of December 1, the current total in L.A. County is 7,655, and the total in California is 19,212.
COVID-19 positive case rates follow a similar pattern. In March, L.A. County reported 6,456 new cases and California reported 8,155 total new cases. In July, L.A. spiked to 79,677 and California to 263,991. In October, L.A. dropped to 1,192 and California to 112,847. As of December 1, the current total in L.A. County is 381,535, and the total in California is 1,212,968.
Hospitalizations and ICU cases in L.A. County and all of California followed suit. In March, L.A. had 1,803 new confirmed hospitalizations and 751 ICU cases, while California had 4,785 hospitalizations and 1,980 ICU cases. In July, L.A. spiked to 63,660 new hospitalizations and 17,565 ICU cases, while California spiked to 201,770 hospitalizations and 53,370 ICU cases. Finally, in October, L.A. dropped to 22,768 new hospitalizations and 6,364 ICU cases, while California dropped to 71,536 hospitalizations and 20,061 ICU cases.
Speculation filled the air about a potential influx of crime in L.A. as a result of the pandemic and social unrest, but trends prove otherwise. In fact, 2020’s crime rates were highest at the start of the year. Looking at crimes reported to the LAPD, January had the highest number of recorded incidents, at 17,835. 15,751 incidents were reported in March, 16,699 in July, and 15,564 in October.
The environment showed slightly different trends in response to the pandemic and stay-at-home orders. The Air Quality Index (AQI) is a numeric scale from 0 to 500 that determines how breathable the air is; the higher the AQI, the greater the level of air pollution. In January, the average AQI was 74; in March, with the safer-at-home order in place, it dipped to 47; In July, it was 133, and in October it was 121.
As COVID-19 vaccines are in the process of being approved and the California government struggles to dole out financial relief, many residents in the state and around the country are hoping these wave-like trends do not continue into 2021.
Sources: California Employment Development Division, California Health & Human Services, L.A. County Public Health, City of Los Angeles Open Data, U.S. EPA Air Data.